Categories
Coding Finance R Statistics

Binomial Pricing Trees in R

Binomial Tree Simulation

The binomial model is a discrete grid generation method from \(t=0\) to \(T\). At each point in time (\(t+\Delta t\)) we can move up with probability \(p\) and down with probability \((1-p)\). As the probability of an up and down movement remain constant throughout the generation process, we end up with a recombining binary tree, or binary lattice. Whereas a balanced binomial tree with height \(h\) has \(2^{h+1}-1\) nodes, a binomial lattice of height \(h\) has \(\sum_{i=1}^{h}i\) nodes.

The algorithm to generate a binomial lattice of \(M\) steps (i.e. of height \(M\)) given a starting value \(S_0\), an up movement \(u\), and down movement \(d\), is:


FOR i=1 to M
FOR j=0 to i
STATE S(j,i) = S(0)*u^j*d^(n-j)
ENDFOR
ENDFOR

We can write this function in R and generate a graph of the lattice. A simple lattice generation function is below:

[source lang=”R”]
# Generate a binomial lattice
# for a given up, down, start value and number of steps
genlattice <- function(X0=100, u=1.1, d=.75, N=5) {
X <- c()
X[1] <- X0
count <- 2

for (i in 1:N) {
for (j in 0:i) {
X[count] <- X0 * u^j * d^(i-j)
count <- count + 1
}
}
return(X)
}
[/source]

We can generate a sample lattice of 5 steps using symmetric up-and-down values:

[source lang=”R”]
> genlattice(N=5, u=1.1, d=.9)
[1] 100.000 90.000 110.000 81.000 99.000 121.000 72.900 89.100 108.900 133.100 65.610
[12] 80.190 98.010 119.790 146.410 59.049 72.171 88.209 107.811 131.769 161.051
[/source]

In this case, the output is a vector of alternate up and down state values.

We can nicely graph a binomial lattice given a tool like graphviz, and we can easily create an R function to generate a graph specification that we can feed into graphviz:

[source lang=”R”]
function(S, labels=FALSE) {
shape <- ifelse(labels == TRUE, "plaintext", "point")

cat("digraph G {", "\n", sep="")
cat("node[shape=",shape,", samehead, sametail];","\n", sep="")
cat("rankdir=LR;","\n")

cat("edge[arrowhead=none];","\n")

# Create a dot node for each element in the lattice
for (i in 1:length(S)) {
cat("node", i, "[label=\"", S[i], "\"];", "\n", sep="")
}

# The number of levels in a binomial lattice of length N
# is `$\frac{\sqrt{8N+1}-1}{2}$`
L <- ((sqrt(8*length(S)+1)-1)/2 – 1)

k<-1
for (i in 1:L) {
tabs <- rep("\t",i-1)
j <- i
while(j>0) {
cat("node",k,"->","node",(k+i),";\n",sep="")
cat("node",k,"->","node",(k+i+1),";\n",sep="")
k <- k + 1
j <- j – 1
}
}

cat("}", sep="")
}
[/source]

This will simply output a dot script to the screen. We can capture this script and save it to a file by invoking:

[source lang=”R”]
> x<-capture.output(dotlattice(genlattice(N=8, u=1.1, d=0.9)))
> cat(x, file="/tmp/lattice1.dot")
[/source]

We can then invoke dot from the command-line on the generated file:

[source lang=”bash”]
$ dot -Tpng -o lattice.png -v lattice1.dot
[/source]

The resulting graph looks like the following:
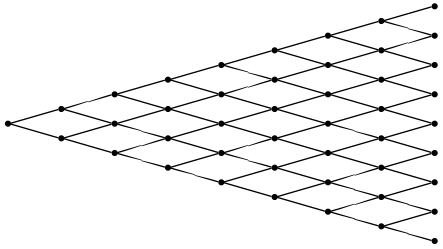
Binomial Lattice
Binomial Lattice (no labels)

If we want to add labels to the lattice vertices, we can add the labels attribute:

[source lang=”R”]
> x<-capture.output(dotlattice(genlattice(N=8, u=1.1, d=0.9), labels=TRUE))
> cat(x, file="/tmp/lattice1.dot")
[/source]
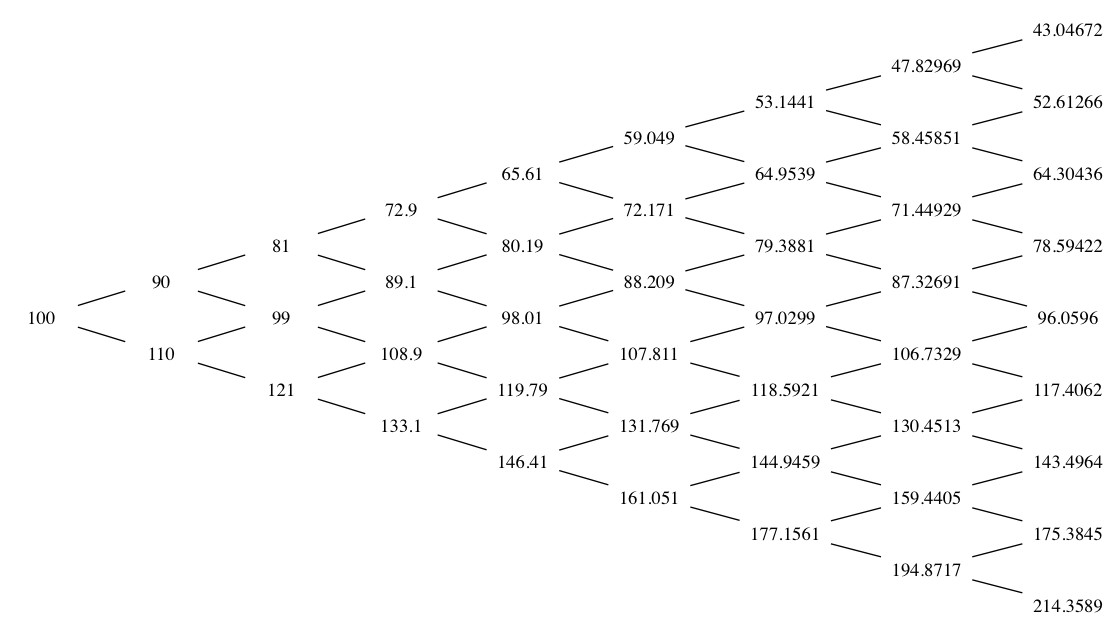
Lattice (labels)
Binomial Lattice (labels)
Categories
Coding R Statistics

Quasi-Random Number Generation in R

Random number generation is a core topic in numerical computer science. There are many efficient
algorithms for generating random (strictly speaking, pseudo-random) variates
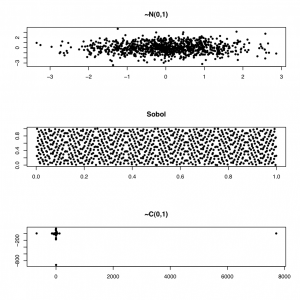
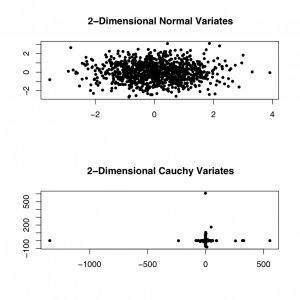
from different probability distributions. The figure below shows a
sampling of 1000 two-dimensional random variates from the standard Gaussian and
Cauchy distributions, respectively. The size of the extreme deviations of the
Cauchy distribution is apparent from the graph.

Gaussian and Cauchy Random Variates

However, sometimes we need to produce numbers that are more evenly distributed (quasi-random numbers). For example, in a Monte Carlo integration exercise, we can get faster convergence with a lower error bound using so-called low-discrepancy random sequences, using the GSL library. In the figure below, we show two-dimensional normal and Sobol (a low-discrepancy generator) variates.

Quasi-Random Numbers
Normal, Cauchy, and Sobol 2-d variates

To generate the graph below, I used the GSL library for R, as shown below:

[source lang=”R”]
library(gsl)
q <- qrng_alloc(type="sobol", 2)
rs <- qrng_get(q,1000)
par(mfrow=c(3,1))
plot(rnorm(1000), rnorm(1000), pch=20, main="~N(0,1)",
ylab="", xlab="")
plot(rs, pch=20, main="Sobol",
ylab="", xlab="")
plot(rcauchy(1000), rcauchy(1000),pch=20,
main="~C(0,1)", ylab="",xlab="")
[/source]

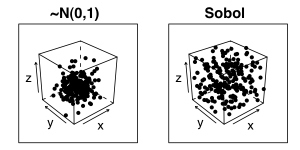
The property of low-discrepancy generators is even more apparent if we view the random variates in a higher dimension, for example the figure below shows the variates as a 3-dimensional cube. Note how the clustering around the centre of the cube is much more pronounced for the Gaussian cube.

3D Random Variates
3D Random Variates

To plot the figure above, I used the GSL and Lattice libraries:

[source lang=”R”]
library(gsl)
library(lattice)
q <- qrng_alloc(type="sobol", 3)
npoints <- 200
rs <- qrng_get(q,npoints)
ltheme <- canonical.theme(color = FALSE)
ltheme$strip.background$col <- "transparent"
lattice.options(default.theme = ltheme)
trellis.par.set(layout.heights =
list(top.padding = -20,
main.key.padding = 1,
key.axis.padding = 0,
axis.xlab.padding = 0,
xlab.key.padding = 0,
key.sub.padding = 0,
bottom.padding = -20))

# Plot the normal variates in a 3-dim cube
p1 <- cloud(rnorm(npoints) ~ rnorm(npoints) + rnorm(npoints), xlab="x", ylab="y",
zlab="z", pch=20, main="~N(0,1)")
p2 <- cloud(rs[,1] ~ rs[,2] + rs[,3], xlab="x", ylab="y",
zlab="z", pch=20, main="Sobol")
print(p1, split=c(1,1,2,1), more=TRUE)
print(p2, split=c(2,1,2,1))
[/source]

Categories
Coding R

The Euler Method In R

The Euler Method is a very simple method used for numerical solution of initial-value problems. Although there are much better methods in practise, it is a nice intuitive mechanism.

The objective is to find a solution to the equation

$$ \frac{dy}{dt} = f(t,y) $$

over a grid of points (equally spaced, in our case). Euler’s method uses the relation (basically a truncated form of Taylor’s approximation theorem with the error terms chopped off):

$$ y(t_{i+1}) = y(t_i) + h\frac{df(t_i, y(t_i))}{dt}$$

In R, we can express this iterative solution as:

[source lang=”R”]
euler <- function(dy.dx=function(x,y){}, h=1E-7, y0=1, start=0, end=1) {
nsteps <- (end-start)/h
ys <- numeric(nsteps+1)
ys[1] <- y0
for (i in 1:nsteps) {
x <- start + (i-1)*h
ys[i+1] <- ys[i] + h*dy.dx(x,ys[i])
}
ys
}
[/source]

Note that given the start and end points, and the size of each step, we figure out the number of steps. Inside the loop, we calculate each successive approximation.

An example using the difference equation

$$ \frac{df(x,y)}{dx} = 3x – y + 8$$

is:

[source lang=”R”]
dy.dx <- function(x,y) { 3*x – y + 8 }
euler(dy.dx, start=0, end=0.5, h=0.1, y0=3)
[1] 3.00000 3.50000 3.98000 4.44200 4.88780 5.31902
[/source]