Categories
Coding kdb R

Integrating Rmathlib and kdb+

The R engine is usable in a variety of ways – one of the lesser-known features is that it provides a standalone math library that can be linked to from an external application. This library provides some nice functionality such as:

* Probability distribution functions (density/distribution/quantile functions);
* Random number generation for a large number of probability distributions

In order to make use of this functionality from q, I built a simple Rmathlib wrapper library. The C wrapper can be found here and is simply a set of functions that wrap the appropriate calls in Rmathlib. For example, a function to generate N randomly-generated Gaussian values using the underlying rnorm() function is:

K rnn(K n, K mu, K sigma) {
int i,count = n->i;
K ret = ktn(KF, count);
for (i = 0; i < count; ++i)
kF(ret)[i] = rnorm(mu->f, sigma->f);
return ret;
}

These have to be imported and linked from a kdb+ session, which is done using special directives (the 2: verb). I decided to automate the process of generating these directives – the code shell script below parses a set of function declarations in a delimited section of a C header file and produces the appropriate load statements:

INFILE=rmath.h
DLL=\`:rmath

echo "dll:$DLL"

DECLARATIONS=$(awk '/\/\/ BEGIN DECL/ {f=1;next} /\/\/ END DECL/ {f=0} f {sub(/K /,"",$0);print $0}' $INFILE)
for decl in $DECLARATIONS; do
FNAME=${decl%%(*}
ARGS=${decl##$FNAME}
IFS=, read -r -a CMDARGS <<< "$ARGS"
echo "${FNAME}:dll 2:(\`$FNAME;${#CMDARGS[*]})"
done

echo "\\l rmath_aux.q"

This generates a set of link commands such as the following:

dll:`:rmath
rn:dll 2:(`rn;2)
rnn:dll 2:(`rnn;3)
dn:dll 2:(`dn;3)
pn:dll 2:(`pn;3)
qn:dll 2:(`qn;3)
sseed:dll 2:(`sseed;2)
gseed:dll 2:(`gseed;1)
nchoosek:dll 2:(`nchoosek;2)

It also generates a call to load a second q script, rmath_aux.q, which contains a bunch of q wrappers and helper functions (I will write a separate post about that later).

A makefile is included which generates the shared lib (once the appropriate paths to the R source files is set) and q scripts. A sample q session looks like the following:


q) \l rmath.q
q) x:rnorm 1000 / generate 1000 normal variates
q) dnorm[0;0;1] / normal density at 0 for a mean 0 sd 1 distribution

The project is available on github: https://github.com/rwinston/kdb-rmathlib.

Note that loading rmath.q loads the rmath dll, which in turn loads the rmathlib dll, so the rmathlib dll should be available on the dynamic library load path.

[Check out Part 2 of this series]
Categories
Coding kdb R

Exporting Data From R to KDB

Here is the beginnings of a simple routine to convert R data frames to Q format (in this case a dictionary). It uses the S3 dispatch mechanism to handle the conversion of different data types. Extremely basic (I havent even bothered to put in proper file output – just capturing the output of cat) but very quick to knock up.

The code is mainly a top-level function called to_dict:

[code lang=”R”]
to_dict <- function(x) {
cat(substitute(x),":", sep="")
nms <- names(x)
for (n in nms) { cat("`",n,sep="") }
cat("!(",sep="")
r <- rep(c(";",")"),times=c(length(nms)-1,1))
for (i in 1:length(nms)) { cat(qformat(x[[nms[i]]]),r[i],sep="") }
}
[/code]

Where qformat is a generic S3 function:

[code lang=”R”]
qformat <- function(x) {
UseMethod("qformat")
}

qformat.default <- function(x) {
cat("",format(x))
}

qformat.logical <- function(x) {
cat(ifelse(x==TRUE,"1b","0b"))
}

qformat.factor <- function(x) {
cat("",gsub("\\s","",format(x)), sep="`")
}
[/code]

It can be used as follows (using the famous Anscombe quartet data):

[code lang=”R”]
> write(capture.output(to_dict(anscombe)),
file="/tmp/anscombe.q")
[/code]

Then within a Q session:

q)\l /tmp/anscombe.q
q)anscombe
x1| 10 8 13 9 11 14 6 4 12 7 5
x2| 10 8 13 9 11 14 6 4 12 7 5
x3| 10 8 13 9 11 14 6 4 12 7 5
x4| 8 8 8 8 8 8 8 19 8 8 8
y1| 8.04 6.95 7.58 8.81 8.33 9.96 7.24 4.26 10.84 4.82 5.68
y2| 9.14 8.14 8.74 8.77 9.26 8.1 6.13 3.1 9.13 7.26 4.74
y3| 7.46 6.77 12.74 7.11 7.81 8.84 6.08 5.39 8.15 6.42 5.73
y4| 6.58 5.76 7.71 8.84 8.47 7.04 5.25 12.5 5.56 7.91 6.89

Categories
Finance R Statistics

Density Estimation of High-Frequency Financial Data

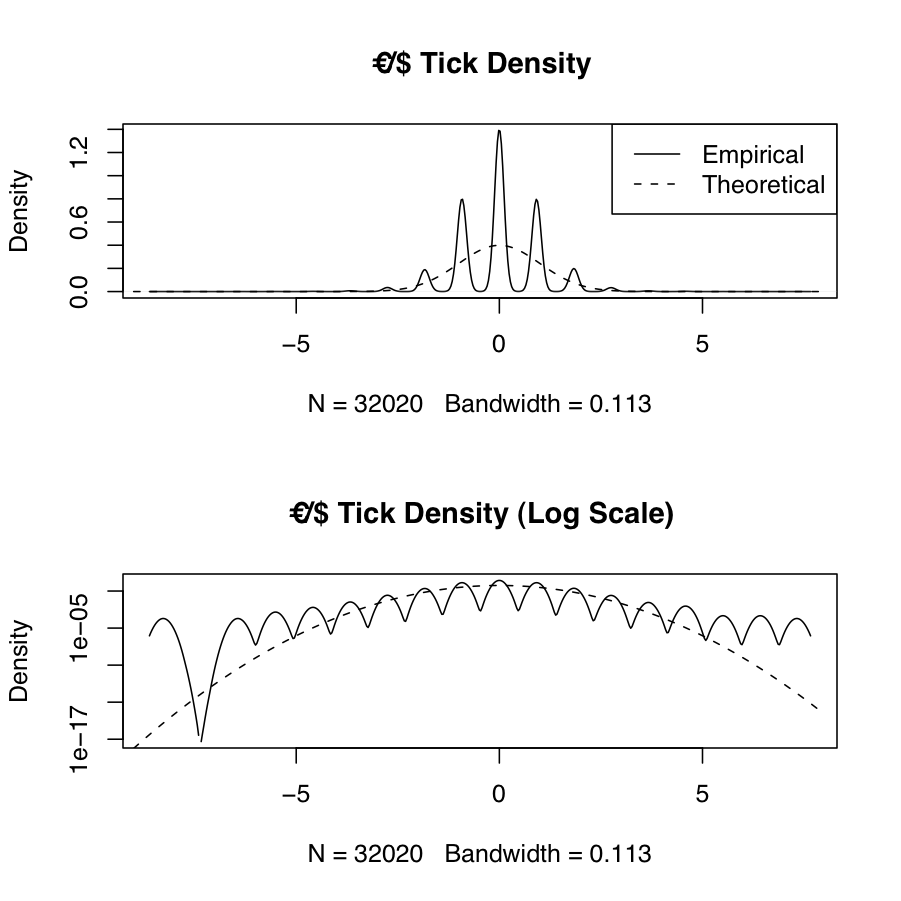
Frequently we will want to estimate the empirical probability density function of real-world data and compare it to the theoretical density from one or more probability distributions. The following example shows the empirical and theoretical normal density for EUR/USD high-frequency tick data \(X\) (which has been transformed using log-returns and normalized via \(\frac{X_i-\mu_X}{\sigma_X}\)). The theoretical normal density is plotted over the range \(\left(\lfloor\mathrm{min}(X)\rfloor,\lceil\mathrm{max}(X)\rceil\right)\). The results are in the figure below. The discontinuities and asymmetry of the discrete tick data, as well as the sharp kurtosis and heavy tails (a corresponding interval of \(\approx \left[-8,+7\right]\) standard deviations away from the mean) are apparent from the plot.

tick density
Empirical and Theoretical Tick Density

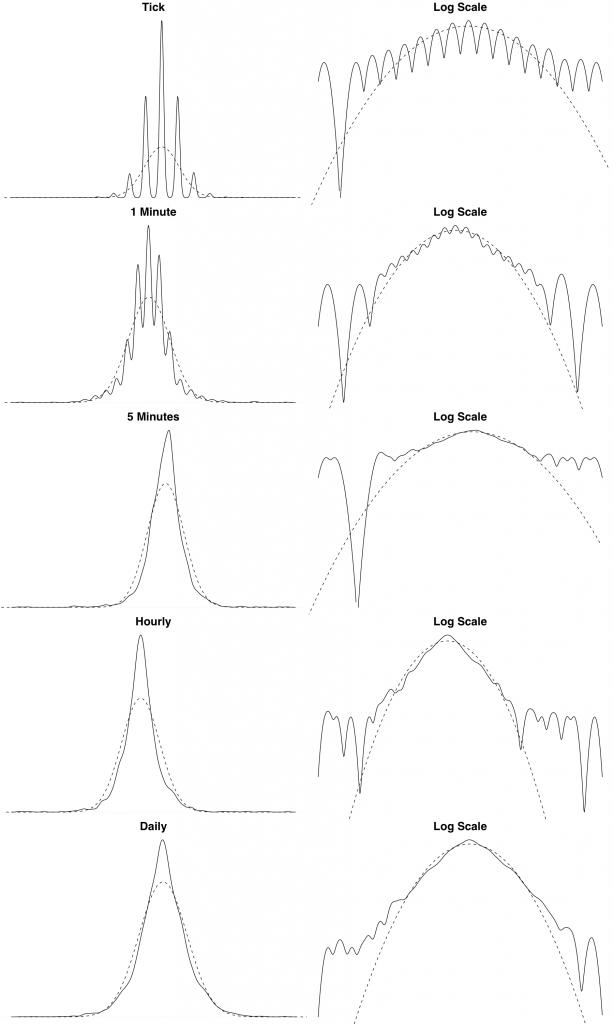
We also show the theoretical and empirical density for the EUR/USD exchange rate log returns over different timescales. We can see from these plots that the distribution of the log returns seems to be asymptotically converging to normality. This is a typical empirical property of financial data.

density_scaled
Density Estimate Across Varying Timescales

The following R source generates empirical and theoretical density plots across different timescales. The data is loaded from files that are sampled at different intervals. I cant supply the data unfortunately, but you should get the idea.

[source lang=”R”]
# Function that reads Reuters CSV tick data and converts Reuters dates
# Assumes format is Date,Tick
readRTD <- function(filename) {
tickData <- read.csv(file=filename, header=TRUE, col.names=c("Date","Tick"))
tickData$Date <- as.POSIXct(strptime(tickData$Date, format="%d/%m/%Y %H:%M:%S"))
tickData
}

# Boilerplate function for Reuters FX tick data transformation and density plot
plot.reutersFXDensity <- function() {
filenames <- c("data/eur_usd_tick_26_10_2007.csv",
"data/eur_usd_1min_26_10_2007.csv",
"data/eur_usd_5min_26_10_2007.csv",
"data/eur_usd_hourly_26_10_2007.csv",
"data/eur_usd_daily_26_10_2007.csv")
labels <- c("Tick", "1 Minute", "5 Minutes", "Hourly", "Daily")

par(mfrow=c(length(filenames), 2),mar=c(0,0,2,0), cex.main=2)
tickData <- c()
i <- 1
for (filename in filenames) {
tickData[[i]] <- readRTD(filename)
# Transform: `$Y = \nabla\log(X_i)$`
logtick <- diff(log(tickData[[i]]$Tick))
# Normalize: `$\frac{(Y-\mu_Y)}{\sigma_Y}$`
logtick <- (logtick-mean(logtick))/sd(logtick)
# Theoretical density range: `$\left[\lfloor\mathrm{min}(Y)\rfloor,\lceil\mathrm{max}(Y)\rceil\right]$`
x <- seq(floor(min(logtick)), ceiling(max(logtick)), .01)
plot(density(logtick), xlab="", ylab="", axes=FALSE, main=labels[i])
lines(x,dnorm(x), lty=2)
#legend("topleft", legend=c("Empirical","Theoretical"), lty=c(1,2))
plot(density(logtick), log="y", xlab="", ylab="", axes=FALSE, main="Log Scale")
lines(x,dnorm(x), lty=2)
i <- i + 1
}
par(op)
}
[/source]