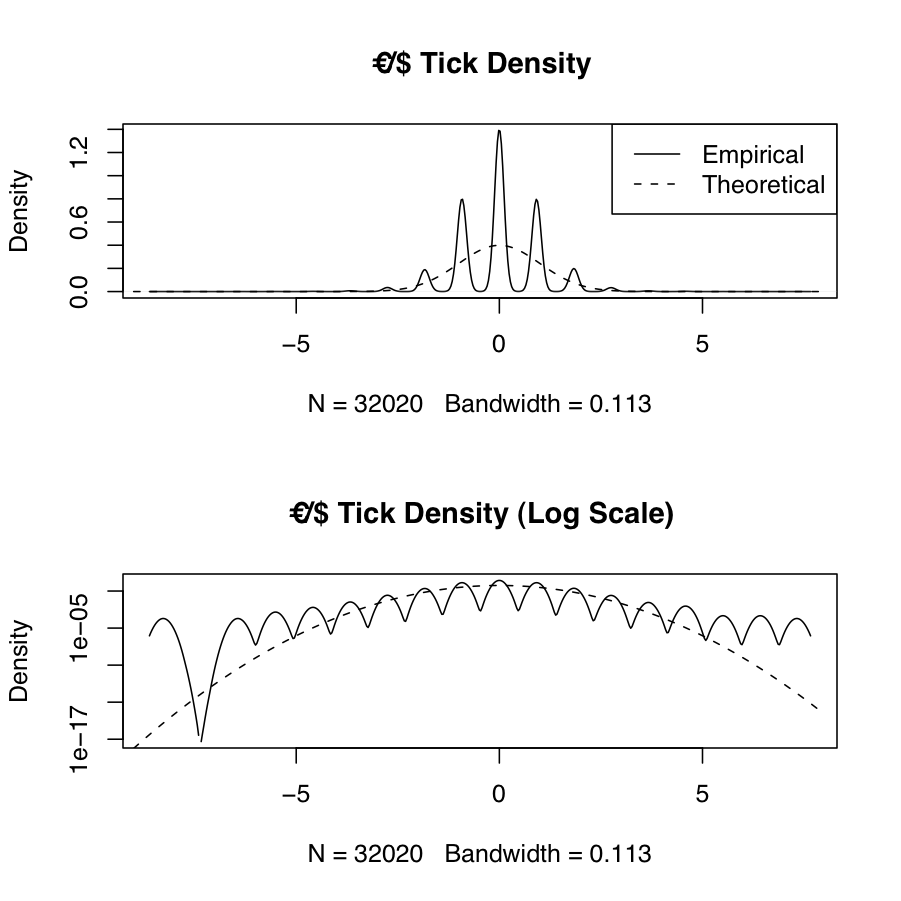
Frequently we will want to estimate the empirical probability density function of real-world data and compare it to the theoretical density from one or more probability distributions. The following example shows the empirical and theoretical normal density for EUR/USD high-frequency tick data \(X\) (which has been transformed using log-returns and normalized via \(\frac{X_i-\mu_X}{\sigma_X}\)). The theoretical normal density is plotted over the range \(\left(\lfloor\mathrm{min}(X)\rfloor,\lceil\mathrm{max}(X)\rceil\right)\). The results are in the figure below. The discontinuities and asymmetry of the discrete tick data, as well as the sharp kurtosis and heavy tails (a corresponding interval of \(\approx \left[-8,+7\right]\) standard deviations away from the mean) are apparent from the plot.

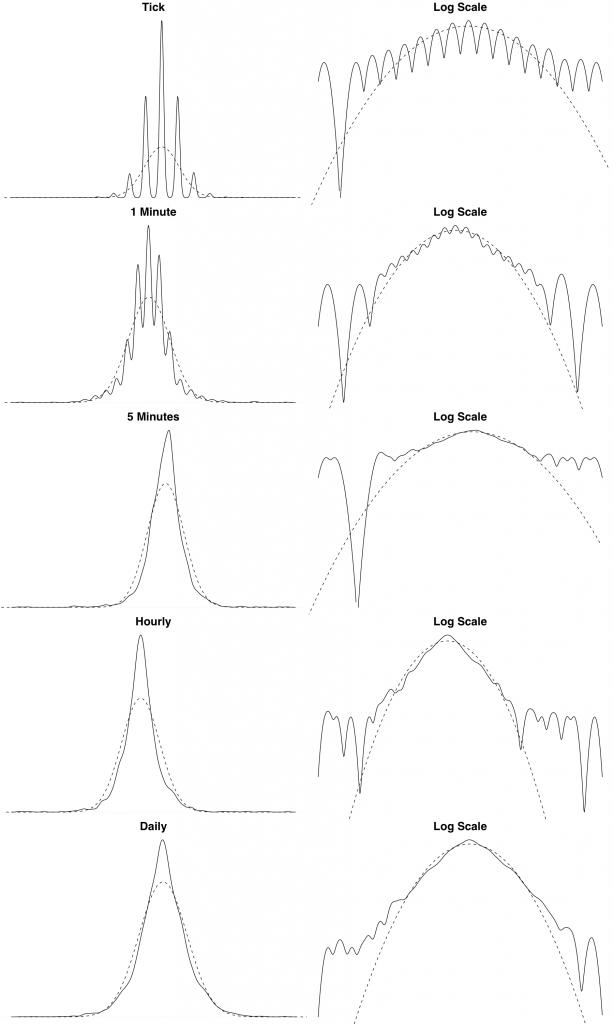
We also show the theoretical and empirical density for the EUR/USD exchange rate log returns over different timescales. We can see from these plots that the distribution of the log returns seems to be asymptotically converging to normality. This is a typical empirical property of financial data.

The following R source generates empirical and theoretical density plots across different timescales. The data is loaded from files that are sampled at different intervals. I cant supply the data unfortunately, but you should get the idea.
[source lang=”R”]
# Function that reads Reuters CSV tick data and converts Reuters dates
# Assumes format is Date,Tick
readRTD <- function(filename) {
tickData <- read.csv(file=filename, header=TRUE, col.names=c("Date","Tick"))
tickData$Date <- as.POSIXct(strptime(tickData$Date, format="%d/%m/%Y %H:%M:%S"))
tickData
}
# Boilerplate function for Reuters FX tick data transformation and density plot
plot.reutersFXDensity <- function() {
filenames <- c("data/eur_usd_tick_26_10_2007.csv",
"data/eur_usd_1min_26_10_2007.csv",
"data/eur_usd_5min_26_10_2007.csv",
"data/eur_usd_hourly_26_10_2007.csv",
"data/eur_usd_daily_26_10_2007.csv")
labels <- c("Tick", "1 Minute", "5 Minutes", "Hourly", "Daily")
par(mfrow=c(length(filenames), 2),mar=c(0,0,2,0), cex.main=2)
tickData <- c()
i <- 1
for (filename in filenames) {
tickData[[i]] <- readRTD(filename)
# Transform: `$Y = \nabla\log(X_i)$`
logtick <- diff(log(tickData[[i]]$Tick))
# Normalize: `$\frac{(Y-\mu_Y)}{\sigma_Y}$`
logtick <- (logtick-mean(logtick))/sd(logtick)
# Theoretical density range: `$\left[\lfloor\mathrm{min}(Y)\rfloor,\lceil\mathrm{max}(Y)\rceil\right]$`
x <- seq(floor(min(logtick)), ceiling(max(logtick)), .01)
plot(density(logtick), xlab="", ylab="", axes=FALSE, main=labels[i])
lines(x,dnorm(x), lty=2)
#legend("topleft", legend=c("Empirical","Theoretical"), lty=c(1,2))
plot(density(logtick), log="y", xlab="", ylab="", axes=FALSE, main="Log Scale")
lines(x,dnorm(x), lty=2)
i <- i + 1
}
par(op)
}
[/source]